Climate Action

Take urgent action to combat climate change and its impacts.

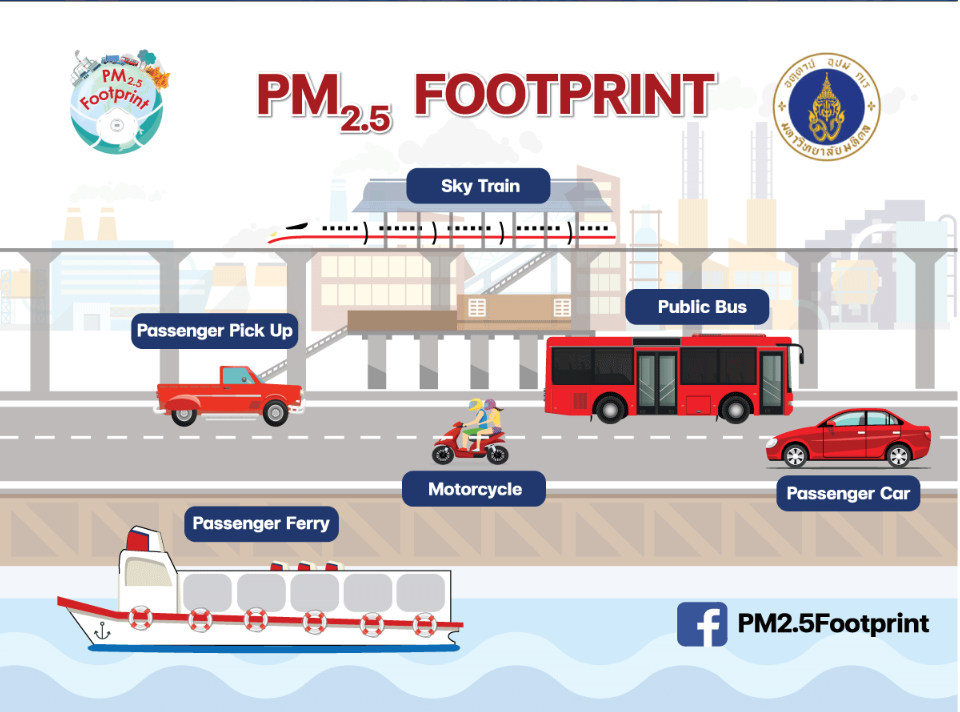
Mahidol University recognizes the impact of climate change on human wellbeing. Therefore, a net-zero greenhouse gas emission policy was established to focus on the least polluting activities with the introduction of the “9 to Zero project”. The project has started by increasing the proportion of renewable energy within the University, including solar rooftops, electric trams and bicycles on campus, and biodiesel from used vegetable oil. The University also plans to increase EV charging stations to promote the use of clean and environmentally friendly technology. It will also continually monitor air quality and dust by creating an innovative PM 2.5 Footprint Calculator to estimate the health effects of fine particulate matter (PM) according to global environmental standards. This raises individuals’ awareness of health risks caused by PM 2.5, and alerts them to change their lifestyles to reduce exposure to dust. The “MU Carbon Footprint” program - a database of greenhouse gas emissions – is used to assess and formulate guidelines for managing greenhouse gases most effectively. In 2020, there were 5,851.44 tons of greenhouse gas emissions at the Salaya campus. The Faculty of Dentistry''''s Low Carbon Hospital used data obtained from the MU Carbon Footprint to manage resources appropriately. This results in reduced costs and greenhouse gas emissions due to the replacement of renewable energy, and has an environmental impact, moving towards a low-carbon city. In addition, the University has arranged several practical activities, such as the project to plant trees to absorb greenhouse gases, and the project to measure trees to collect data on greenhouse gas reabsorption in 2022 - the 13,640 trees at Salaya campus can absorb up to 6,523.20 tons of carbon dioxide equivalent. Green space is increased by the Vertical Garden Project, by 5.92% of all green space in the University. The MU Eco Park project increases tree-planting to reduce heat, preserve natural ecosystems, and influence a higher rate of greenhouse-gas reabsorption The Eco Town project - a collaboration with PTT to expand knowledge on waste management, and recycling instead of incineration, a cause of air pollution – demonstrates that the University is actively planning and preparing for climate change and its impacts, in line with the Sustainable Development Goals..

Highlights
  • thumb
    11 13
    24 Jan. 2566
    TOD City Development and Sustainable Communities Guidelines
    The concept of city and community is developed along with the transportation infrastructure. We focus on the development of areas around public transport stations that are the center of travel connections. The model of city has been determined for maximum benefit to create a quality community that is pleasant to live, attractive for business investment, and encourage to travel by public transport. The concept of TOD city management is to change the expansion of a scattered city to a compact city by using guidelines that will reduce the burden of city growth. Transport infrastructure is the backbone of urban development and expansion. Transit Oriented Development (TOD) urban development The concept of city and community is developed along with the transportation infrastructure. We focus on the development of areas around public transport stations that are the center of travel connections. The model of city has been determined for maximum benefit to create a quality community that is pleasant to live, attractive for business investment, and encourage to travel by public transport. The concept of TOD city management is to change the expansion of a scattered city to a compact city by using guidelines that will reduce the burden of city growth. Transit Oriented Development (TOD) will solve urban problems and benefit communities. The government will have clear and concrete guidelines for managing the city, changing travel behavior from private cars to public transport will help reduce pollution, and providing facilities for walking or cycling will reduce travel by private cars. In addition, the local economy will develop to fit every lifestyle, including residential areas, commercial areas, business areas, and public areas. Utilities are available and accessible to everyone, saving travel costs, reducing energy consumption, and fostering a good environment in the community.
  • thumb
    13
    24 Jan. 2566
    PM2.5 FOOTPRINT
    Fine particulate matter (PM2.5 or fine particulate matter with a diameter up to 2.5 microns) is one of the most important causes of premature deaths. The World Health Organization (WHO) estimated that outdoor air pollution caused 4.2 million premature deaths globally in 2016 due to PM2.5 exposure. The PM2.5 exposure could lead to cardiovascular and respiratory disease, and cancers (WHO, 2021). In Thailand, overall PM2.5 concentrations have been reduced continuously. Nonetheless, the annual average PM2.5 concentrations in Thailand have still exceeded the World Health Organization standards throughout the past 10 years. Transport sector is one of the major sources of PM2.5 emissions. Understanding the potential health impacts and costs of PM2.5 formation from different modes of transport will help raising the awareness of the public due to the realisation on the PM2.5 footprint of their actions. PM2.5 footprint is considered as the health impacts from PM2.5 formation throughout life cycle of products and organisations. PM2.5 footprint is quantified by multiplying emissions with characterisation factors. Afterwards, the health costs could be obtained by economic evaluation of the health impacts. The PM2.5 Footprint Calculator v1.01 was developed as a tool for enhancing environmentally sustainable passenger transport in Thailand. The PM2.5 Footprint Calculator v1.01 can determine primary and secondary PM2.5 emissions (PM2.5, NOx, NH3, and SO2) and assess health impacts and costs of passenger transport by road, water and rail in Thailand. The calculator consists of primary and secondary PM2.5 emission inventory (for passenger transport), city-specific characterisation factors, and health cost conversion factor. The details of emission inventory, impact characterisation and economic valuation can be seen the background report of PM2.5 Footprint Calculator v1.01 (Prapaspongsa et al., 2021). Features of the current version and future updates of the PM2.5 footprint calculator are also documented in the report. The PM2.5 Footprint Calculator v1.01 is provided in two versions including Web-Based PM2.5 Footprint Calculator and PM2.5 Footprint Calculator (Microsoft Excel Program). Users can directly apply the Web-Based PM2.5 Footprint Calculator via this PM2.5 footprint website or download the PM2.5 Footprint Calculator (Microsoft Excel Program) from this website for own calculations. The Web-Based PM2.5 Footprint Calculator computes the health impacts and costs from "well-to-wheel" including emissions from upstream fuel and electricity production; and exhaust emissions from fuel combustion. The PM2.5 Footprint Calculator (Microsoft Excel Program) can assess health impacts and costs both from "well-to-wheel" and "tank-to-wheel”. In the tank-to-wheel scope, the exhaust emissions from fuel combustion (indicated as "vehicle use" in this excel) are considered.
Number of items 14 Items